- News
- Reviews
- Bikes
- Accessories
- Accessories - misc
- Computer mounts
- Bags
- Bar ends
- Bike bags & cases
- Bottle cages
- Bottles
- Cameras
- Car racks
- Child seats
- Computers
- Glasses
- GPS units
- Helmets
- Lights - front
- Lights - rear
- Lights - sets
- Locks
- Mirrors
- Mudguards
- Racks
- Pumps & CO2 inflators
- Puncture kits
- Reflectives
- Smart watches
- Stands and racks
- Trailers
- Clothing
- Components
- Bar tape & grips
- Bottom brackets
- Brake & gear cables
- Brake & STI levers
- Brake pads & spares
- Brakes
- Cassettes & freewheels
- Chains
- Chainsets & chainrings
- Derailleurs - front
- Derailleurs - rear
- Forks
- Gear levers & shifters
- Groupsets
- Handlebars & extensions
- Headsets
- Hubs
- Inner tubes
- Pedals
- Quick releases & skewers
- Saddles
- Seatposts
- Stems
- Wheels
- Tyres
- Health, fitness and nutrition
- Tools and workshop
- Miscellaneous
- Cross country mountain bikes
- Tubeless valves
- Buyers Guides
- Features
- Forum
- Recommends
- Podcast
TECH NEWS
 2021 Strava 3D_Heatmap_Clubpost_Global
Strava goes 3D with new Terrain Mode feature
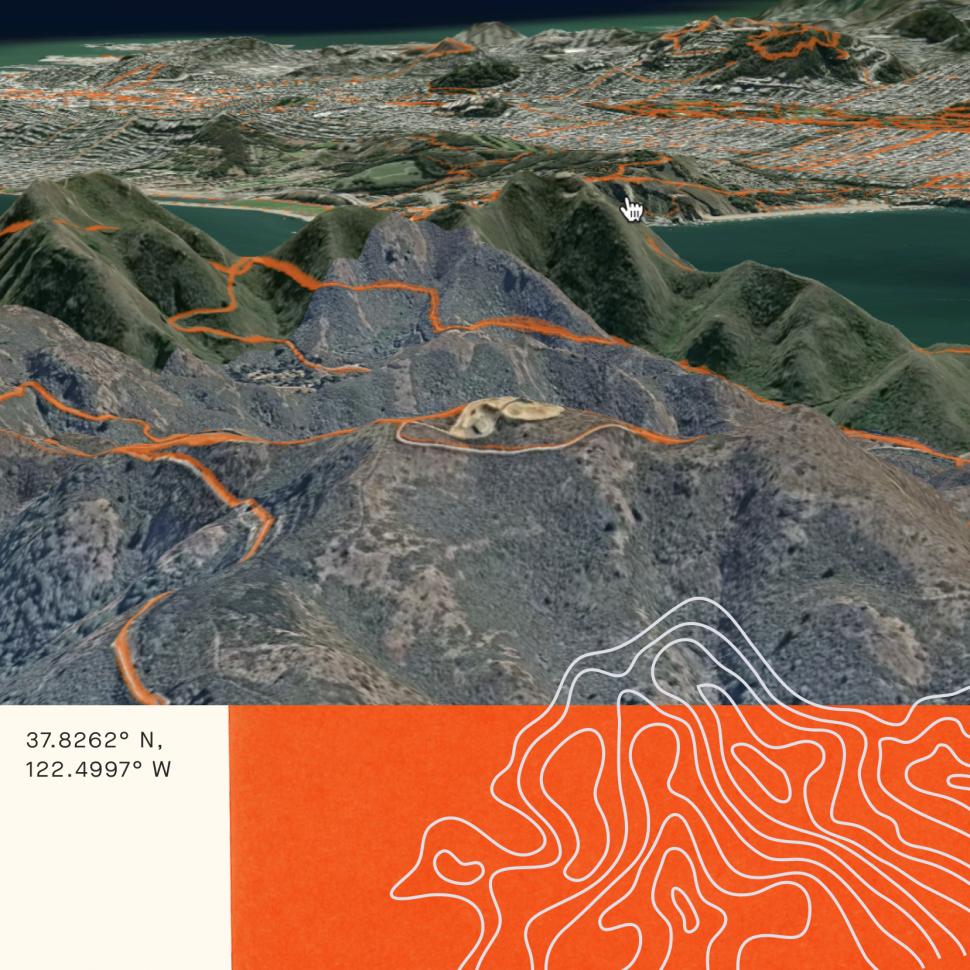
Strava has launched its new 3D Terrain Mode feature within its personal heatmaps to bring a “fresh dynamic to heatmaps the visual terrain experience”. The new feature goes live today on World Earth Day.
The fitness tracking app already has personal heatmaps and this new extension brings Strava’s maps in 3D.
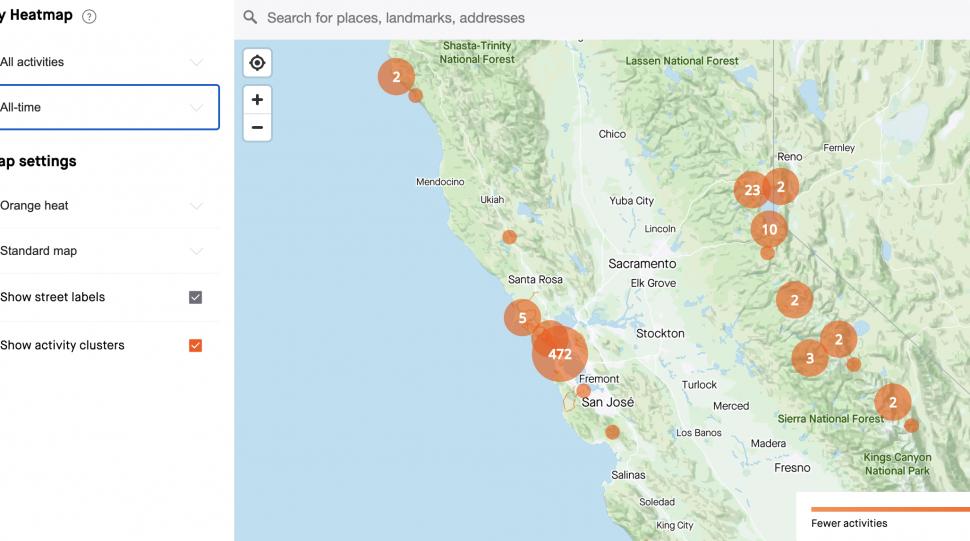
Your personal heatmap brings together all the rides you have completed, with the strength of the colour of the line showing how many times you’ve ridden each section. It’s a good way of redoing roads you’ve ridden previously or seeing areas you haven’t been to before so you can explore new places.
> 8 things you didn’t know about Strava — advanced features for exploring and performance analysis
“Now the record of activities will reflect real life, and the terrain an athlete covered during the activity,” says Strava.
With this new 3D feature it’ll be easier to work out post-ride which roads were uphill or downhill sections.
This new full experience will be available to subscribers only, and it’s only accessible when using Strava on the web. It will not be available on iOS or Android app at this time.
Strava has also recently made some other map updates.
Satellite map imagery has been updated across all of Strava’s surfaces, including routes, personal heatmap, and activity uploads – on both mobile and web.
The new satellite images are, on average, from the last two years or newer, and Strava says this provides more accurate context and more seamless exploring from place to place and across zoom levels.
Strava has also replaced the Strava app record screen map (previously Apple Maps on iOS and Google Maps on Android) to Mapbox on both platforms. This is said to provide a consistent map view across all of Strava’s surfaces.
Anna has been hooked on bikes ever since her youthful beginnings at Hillingdon Cycle Circuit. As an avid road and track racer, she reached the heady heights of a ProCyclingStats profile before leaving for university. Having now completed an MA in Multimedia Journalism, she’s hoping to add some (more successful) results. Although her greatest wish is for the broader acceptance of wearing funky cycling socks over the top of leg warmers.
Latest Comments
- Rendel Harris 1 sec ago
You seem to be making an assumption that the guilty party was an illegal immigrant and/or was working illegally, I can't see anything in the...
- Miller 3 min 2 sec ago
Don't think it costs much if anything to pump out crap on Twit/X ?
- andystow 18 min 28 sec ago
I'm 53, and gained most of my cycling fitness after age 43. I've never done an FTP test nor used a power meter, but based on occasionally asking...
- ubercurmudgeon 19 min 40 sec ago
I doubt you'll need to worry about facing that particular dilemma: by the time you find yourself in need of a pump, it'll probably have fallen off...
- mdavidford 37 min 3 sec ago
Except that presumed liability is usually a matter of civil liability, so you wouldn't be prosecuted as a result of it (though you may be held...
- brooksby 1 hour 5 min ago
Didn't know that, thanks. I wonder whether he also pushed for regulation of sex work…
- brooksby 1 hour 7 min ago
I always find it surprising how little often needs to be changed, to have the bike feel more comfortable. Often literally a case of lifting...
- Rendel Harris 1 hour 25 min ago
Well, I finally got some response from my repeated requests as to what was happening with the alleged database and was supplied with a link which...
- brooksby 2 hours 56 min ago
Thanks - was about to say that.
- Miller 4 hours 9 min ago
Don't buy American.

Add new comment
11 comments
Veloviewer have been doing this for years.
£10 a year gives you loads of stats (if you're stat orientated - which I'm not), plus 3d mapping and Google Earth fly-by of the rides you have already completed.
For route plotting, PlotaRoute gives you a nice solid graph at the bottom of the screen showing either height or percentage of the selected plotted route / segment.
I've still not seen anything from Strava that makes me want to sign up for a subscription
Veloviewer doesn't work any longer if you don't have a Strava subscription.
The elevation isn't very obvious on my local climbs which are about 70m (short but steep).
Can we please have more contrast on the map views - white on beige / green is difficult to see when you're on a bike.
Does it show you phoney elevation for phoney virtual "climbs" also
I'd love to have a life so free of worry and concern that this was something that bothered me.
I can recommend it
Did someone forget to copy/paste the rest of the sentence?
...or you could just use a map.
I'm wanting a feature like this for route planning, it's a bit late after the ride to learn the pitch of the hill that killed you.
I use Komoot rather than Strava, but same problem. I can plan a route and yes, I can see the elevation profile on a linear chart underneath. It's a start, but not much use. I think it would be better if the roads could optionally be colour coded by gradient so that, having plotted a route, you could easily discern detours to decapitate the worst peaks.
#elevationmap in the description on strava mobile is a nice way to view post ride hillage.
In the komoot app, you can move your finger across the gradient chart and see the corresponding point on the map above.